Model 310 Software Features
The frequency response analyzer software (APfra.exe) program uses a PC based Windows platform to provide a virtual control panel and graphing windows user interface to the frequency response analyzer hardware. The software's user interface offers the following key features:
Virtual Front Panel Features - Windows® based graphical user interface with real time plotting
- Virtual instrument front panel for complete access to all system parameters
- Automatic or manual scaling and shifting of screen plots for optimum viewing
- Advanced marker functions and master graphs give data and delta readouts
- Advanced functions including complex impedance
- A graphics display which plots the acquired data in a variety of formats, called display modes and provides real-time data analysis through markers and master or reference traces
| Data Management Features - Data transfer. Measured data is made available to other applications through data files, the clipboard, image files, and Dynamic Data Exchange (DDE).
- Environment persistence. Can save and restore all the display attributes and analyzer parameters (including special calibrations) for a particular measurement.
- Allows working offline providing the convenience of analyzing data files without the analyzer hardware connected.
|
See the Model 310 Manual for in-depth detail on the Model 310 Software.
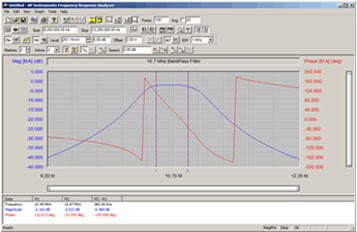
Front Panel
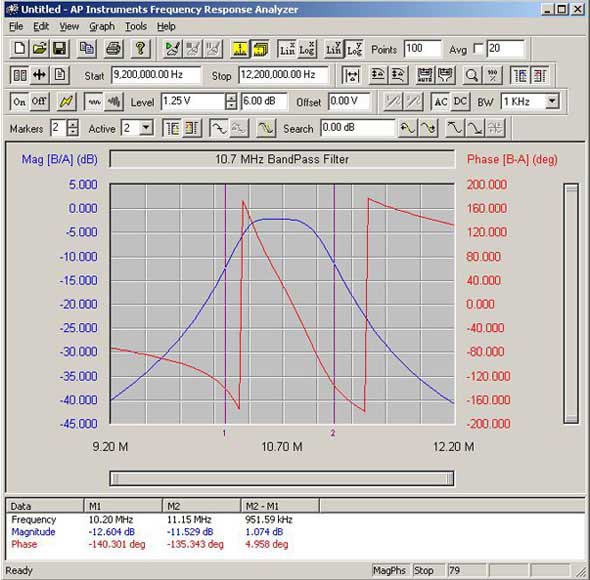
Hover over graph areas for graph features.
Front Panel Screen Samples:
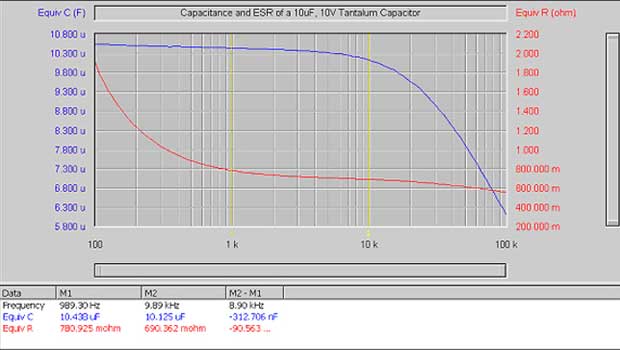
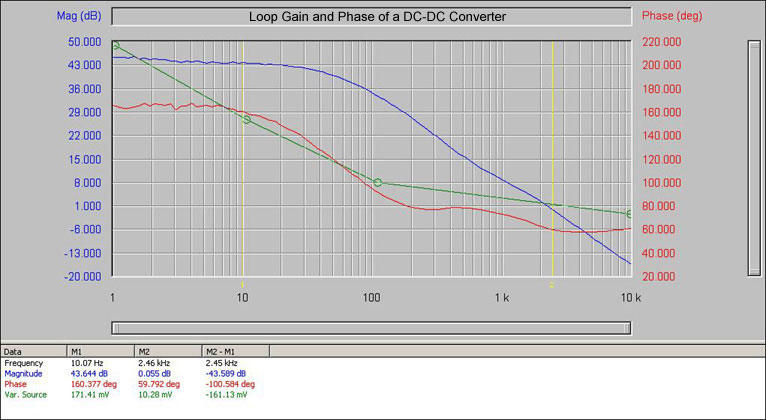
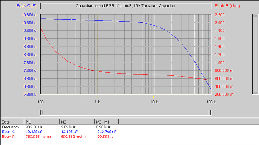
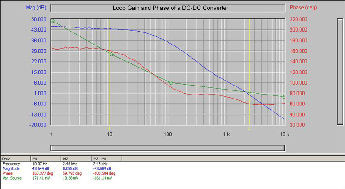
| Instrument Control and Graph Data Area Toolbars: | Capacitance and Equivalent Series Resistance: | Loop Gain and Phase of a DC-DC Converter: |
 |  |  |
Click on a graph thumbnail for a larger image.